Our methodology for the savings statistics displayed on Ralo.com/reviews
At Ralo, we believe that any savings claim we make should be transparent, verifiable, and grounded in an independent benchmark, not one we invented ourselves. This page explains exactly how we calculate the Average Lifetime Savings figure you see on our reviews page: where the data comes from, how we make apples-to-apples comparisons, and what the number does and doesn't include.
The short version
Average Lifetime Savings measures the difference in total interest a borrower would pay over the full term of their mortgage at the rate they qualified for on Ralo versus the national average rate published that same week by Freddie Mac's Primary Mortgage Market Survey® (PMMS®). We only make this comparison for loans that match the exact borrower and loan profile Freddie Mac uses in its survey, so the comparison is like-for-like. We then average those individual savings figures across all eligible Ralo borrowers to produce the statistic on our site.
Why we benchmark against Freddie Mac's PMMS
Freddie Mac has published a weekly national mortgage rate benchmark since 1971, and the PMMS is widely regarded as the industry standard for tracking U.S. mortgage rates. It is cited by the Federal Reserve, major news organizations, and economists across the housing industry.
In November 2022, Freddie Mac enhanced the PMMS methodology. Rather than surveying a sample of lenders, the PMMS rate is now calculated from thousands of actual loan applications submitted each week to Freddie Mac's Loan Product Advisor® automated underwriting system, covering lenders in all 50 states plus the District of Columbia. Each weekly figure reflects applications received from Thursday of the prior week through Wednesday, published every Thursday. That gives us a broad, independent, real-time measure of what the average well-qualified borrower is being offered nationally, and it's the yardstick we use to measure Ralo rates. You can read Freddie Mac's full methodology in their research note.
Step 1: Establish the national average for the week
For each calendar week, we record the PMMS national average rate for the 30-year fixed-rate mortgage and the 15-year fixed-rate mortgage as published by Freddie Mac that Thursday.
Step 2: Identify comparable Ralo loans from the same week
A rate comparison is only meaningful if both rates describe the same kind of borrower and the same kind of loan. The PMMS is not an average of all mortgages. It reflects a specific, well-qualified borrower profile. So we normalize: we only include Ralo loans from that same week that match the PMMS survey parameters, which are:
- Conventional (not government-backed, e.g., not FHA, VA, or USDA)
- Conforming (at or below the national conforming loan limit; loans in Alaska, Hawaii, and U.S. territories are excluded because they carry higher statutory loan limits)
- 30-year or 15-year fixed rate, fully amortizing
- Purchase transaction
- Zero discount points
- Borrower FICO score of 740 or above
- Loan-to-value ratio between 75% and 80% (inclusive)
- Single-family, single-unit property
- Owner-occupied
We compare the rate the borrower actually qualified for on Ralo that week against the PMMS average from the same week, so both figures reflect the same interest-rate environment.
We exclude jumbo loans, adjustable-rate mortgages, government-backed loans, refinances, investment properties, borrowers with sub-740 credit, and other loan types that don't fit the PMMS profile. Not because Ralo can't offer competitive rates on those products, but because there is no comparable national average to measure them against. We would rather report a narrower statistic honestly than a broader one built on mismatched comparisons.
Step 3: Calculate lifetime interest under each rate
For each eligible loan, we run a standard fixed-rate amortization calculation twice on the same loan amount and term: once at the PMMS national average rate for that week, and once at the rate the borrower qualified for on Ralo. The difference in total interest paid over the full term of the loan is that borrower's lifetime savings.
Step 4: Average across borrowers
Finally, we average the individual lifetime savings figures across all eligible Ralo borrowers in the reporting period. That average is the Average Lifetime Savings statistic displayed on Ralo.com/reviews. The figure is recalculated on a rolling basis as new eligible loans are added.
A worked example
Suppose a borrower comes to Ralo during a week when the Freddie Mac PMMS reports a national average 30-year fixed rate of 6.75%. That same week, a borrower with a 745 credit score puts 20% down on a $500,000 single-family home they'll live in, pays zero points, and qualifies for a 6.00% conventional conforming 30-year fixed rate on Ralo. The loan amount is $400,000.
| National average (PMMS) | Ralo rate | |
|---|---|---|
| Interest rate | 6.75% | 6.00% |
| Loan amount | $400,000 | $400,000 |
| Term | 30-year fixed | 30-year fixed |
| Monthly principal & interest | $2,594.39 | $2,398.20 |
| Total interest over 30 years | $533,981 | $463,353 |
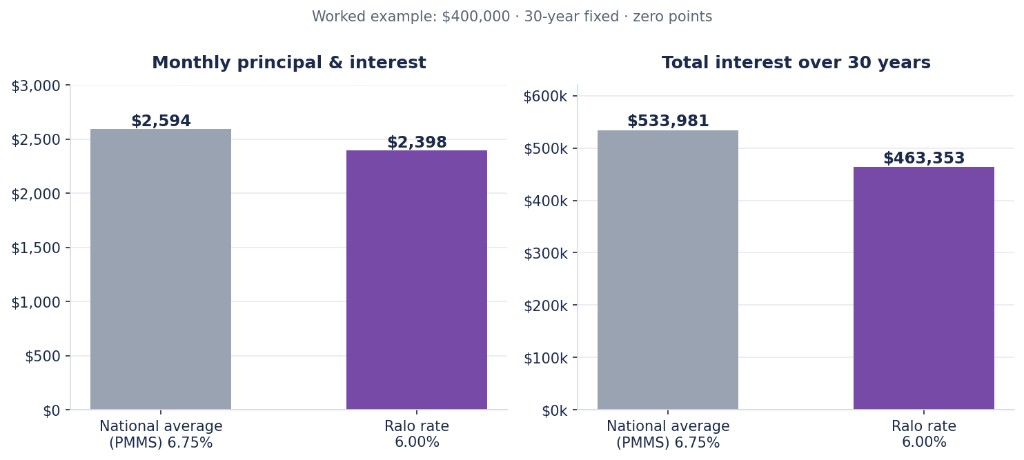
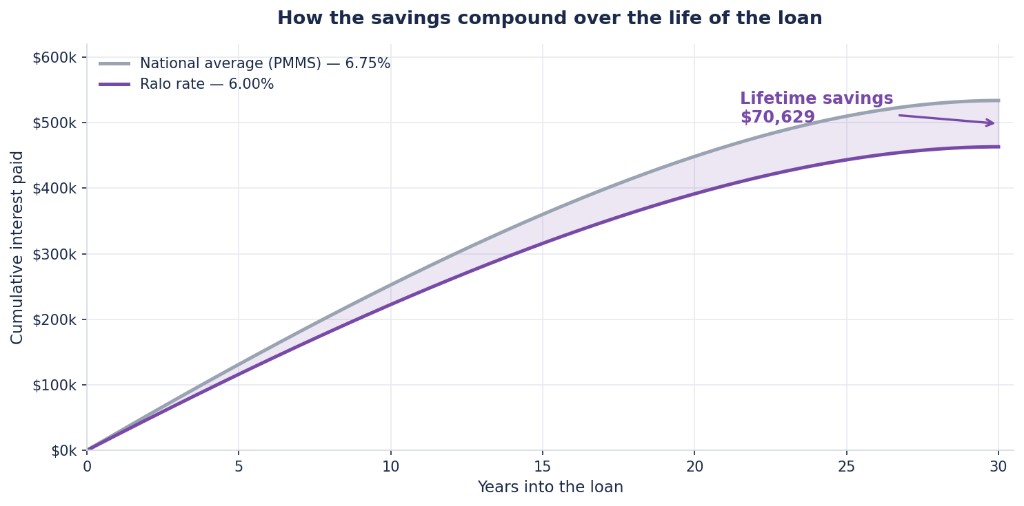
The three-quarters-of-a-point difference works out to about $196 per month. Compounded over the full 360-payment life of the loan, this borrower saves $70,629 in interest compared with the national average rate that week. That $70,629 is this borrower's lifetime savings figure, and it gets averaged together with every other eligible borrower's figure to produce the statistic we publish.
The chart below shows how the gap widens with every payment. The shaded area between the two curves is the borrower's savings accumulating over the life of the loan:
Assumptions and limitations
In the interest of full transparency, here is what the metric assumes and what it leaves out:
The calculation assumes the loan is held to full term. Most borrowers sell or refinance before year 30. A borrower who refinances after seven years would realize only a portion of the projected lifetime savings, though the rate advantage during the years they do hold the loan is real.
PMMS reflects application-stage rates, not closed loans. Freddie Mac's methodology measures rates at the loan-application stage rather than at closing. We match this by using the rate the borrower qualified for on Ralo during the same week, so both sides of the comparison are measured at the same stage.
Timing is matched at the weekly level. Rates move daily. By comparing against the PMMS average for the same survey week, we reduce day-to-day timing effects within a week, though we can't remove them entirely.
The average reflects eligible loans only. Because the metric includes only PMMS-comparable loans, it describes savings for well-qualified borrowers on conventional conforming fixed-rate purchase loans. Individual results vary based on credit profile, loan amount, property type, location, market conditions at the time of the quote, and other factors. The Average Lifetime Savings figure is a historical statistic, not a promise of future savings for any individual borrower.
Points and fees. Both the PMMS rate and the Ralo rates used in this metric assume zero discount points, so neither side of the comparison is artificially lowered by upfront buydowns. The metric compares interest cost only; it does not incorporate differences in closing costs or lender fees.
Why we built it this way
Plenty of savings claims in the mortgage industry compare a lender's best-case rate against a vague "market rate" of unclear origin. We deliberately chose the opposite approach: an independent, federally chartered institution's published benchmark, a strict same-week comparison, and a normalization filter that throws out any loan we can't compare fairly, even when including those loans would make our number look better. If you have questions about this methodology, we're happy to answer them.
Freddie Mac, Primary Mortgage Market Survey®, PMMS®, and Loan Product Advisor® are trademarks of Freddie Mac. Ralo is not affiliated with or endorsed by Freddie Mac.

